




Plantation OS
Running Vehicle
Automate Preventive Maintenance and Heavy Equipment Tracking to Lock In Peak Operational Efficiency.
The Trap of Heavy Equipment Breakdowns and Stranded Infrastructure Projects
Manual Vehicle Running logs are notoriously inaccurate, triggering wasted fuel consumption and uncontrolled spare parts replacements. Civil engineering projects frequently stall due to equipment breakdowns without clear preventive maintenance schedules.
local_gas_station
Inaccurate Running Logs
Manual fuel and hour-meter logs trigger wasted fuel consumption.
handyman
Uncontrolled Spare Parts Spend
Workshop replacements go untracked against actual equipment usage.
construction
Stalled Infrastructure Projects
Equipment breakdowns without preventive schedules halt road and drainage work.
Features
speed
Hour Meter / KM Logging
Automatic engine hour tracking triggers Preventive Maintenance schedules.
build
Workshop Costing
Spare parts consumption and service costs tracked per unit.
engineering
Civil Engineering
Road, bridge, and drainage projects orchestrated in real time.
event_available
Project Management
Heavy equipment allocated across projects without scheduling overlaps.
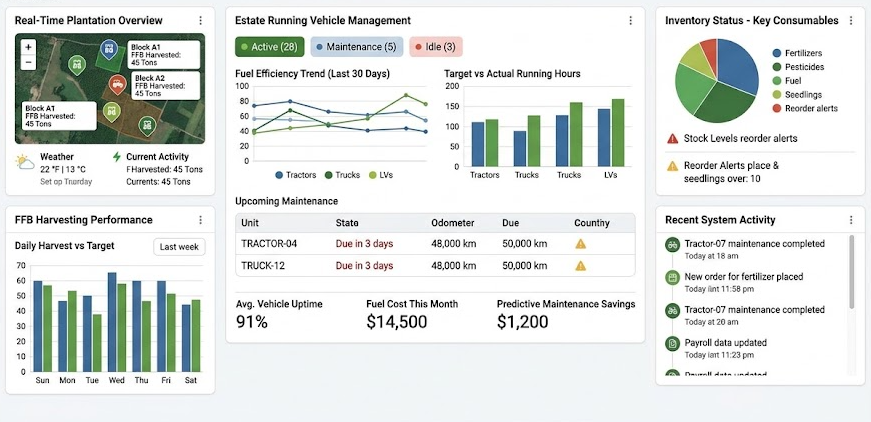
Fleet Data Driving Field and Financial Decisions
Vehicle utilization feeds budget planning, estate scheduling, and executive dashboards, turning every engine hour into a cost-control signal.
pie_chart
Budget
Fuel and fleet repair actual track against activity based budgets.
agriculture
Estate
FFB Transport and field logistics dispatch straight from fleet availability.
insights
Business Intelligence
Cost per Kilometer and asset position visualized live on the map.
Cut Fleet Costs, Maximize Uptime, and Accelerate Projects
This automation slashes fleet operating costs by eliminating fuel leakage and extending heavy machinery lifespans. Planned preventive maintenance removes the risk of sudden downtime right when peak harvest season arrives, giving full control over CapEx and OpEx efficiency.
20–30%
Lower Fleet Operating Costs
Fewer
Peak Season Breakdowns
On Time
Infrastructure Project Delivery